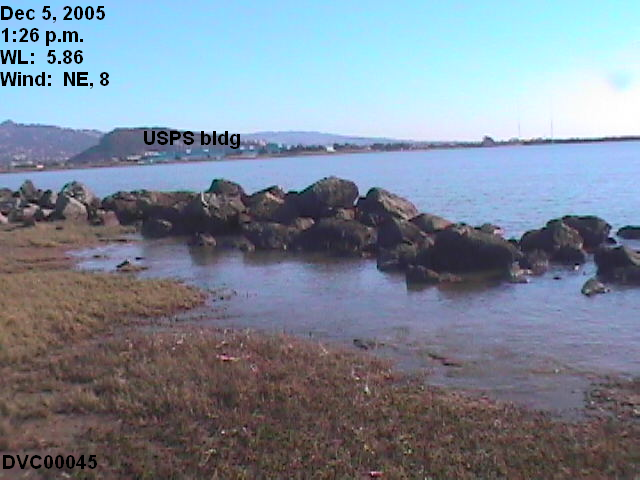
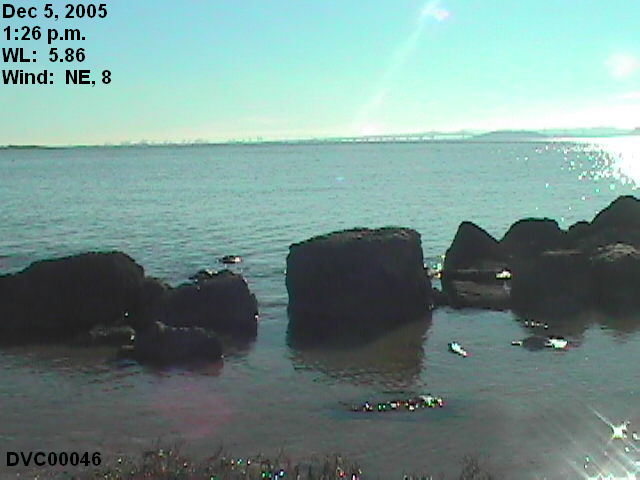
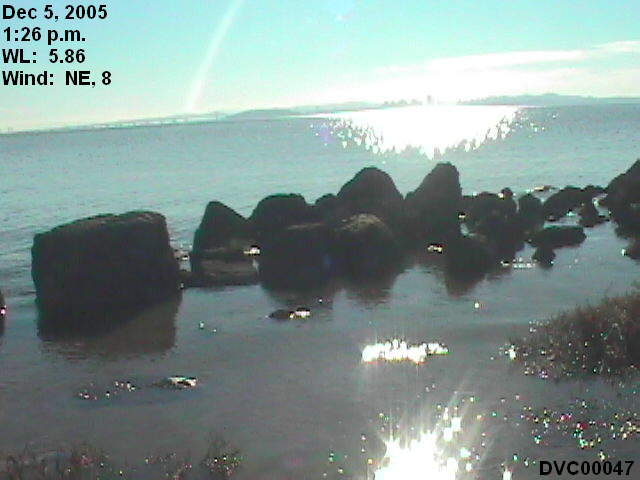
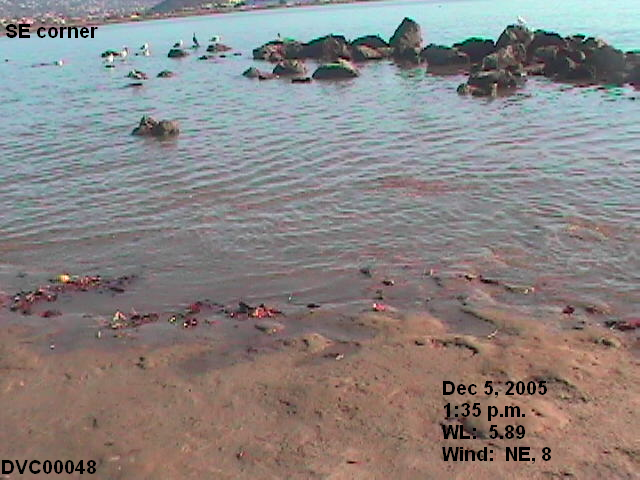
Richmond Jetty -- December 5, 2005
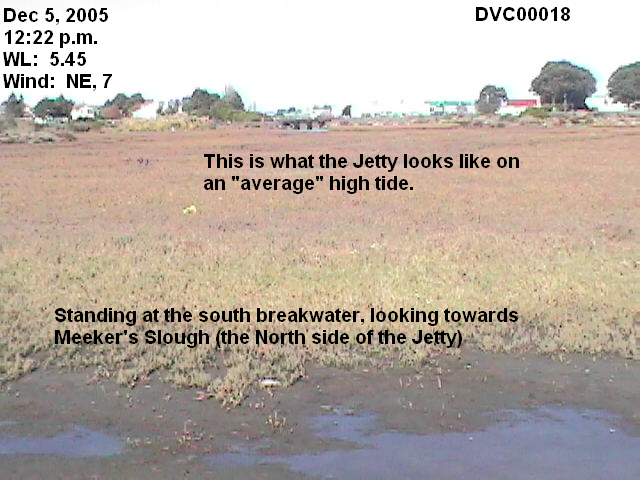
Purpose: To correctly identify the location Conner was found; to capture on film a rising tide equivalent to the April 13, 2003 high tide; and to determine if Conner could have washed ashore from any direction.
Actual Water Level
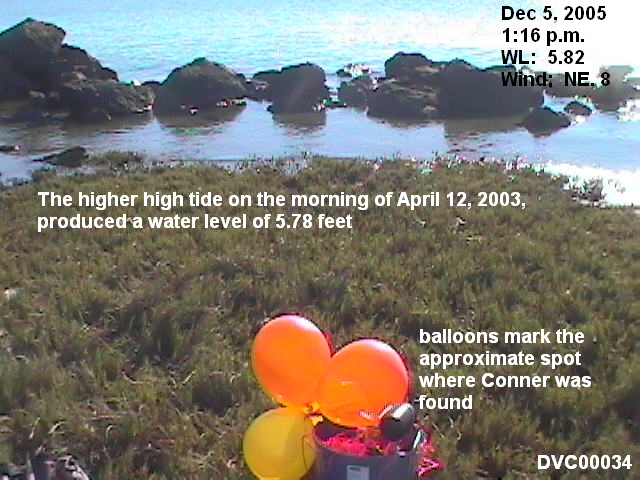
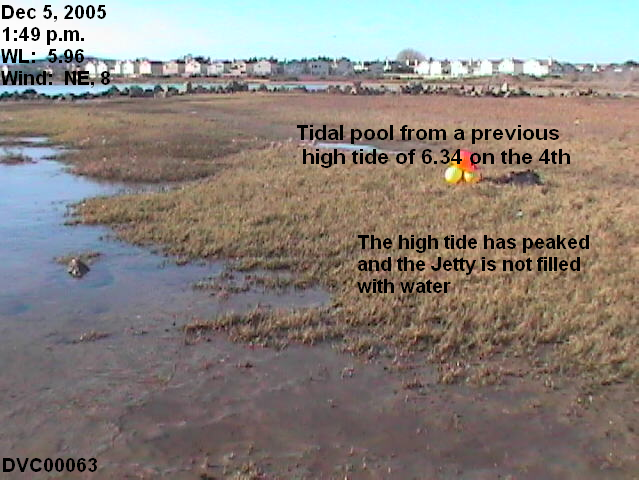
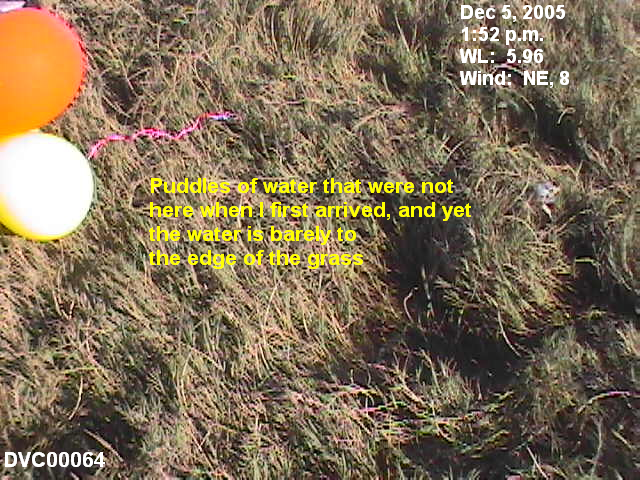
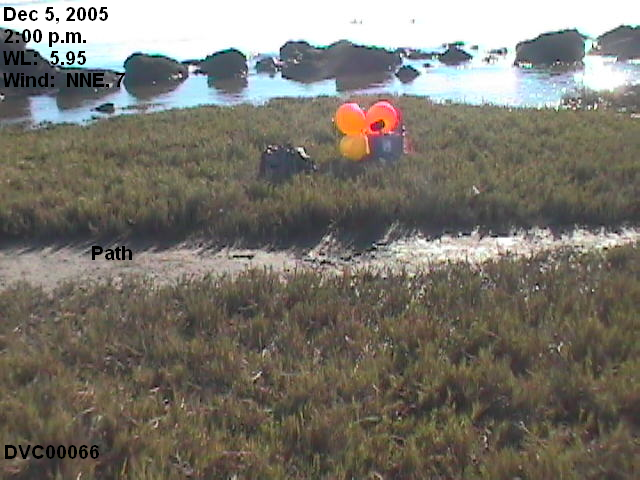
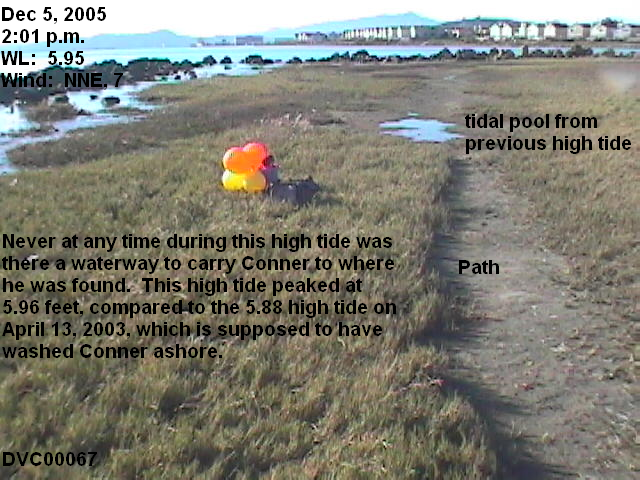
High tide was predicted to peak at 1:53 p.m., with a water level of 6.3 feet above MLLW. Unfortunately, the 9414863 Richmond, Chevron Pier station was temporarily out of order on this date, so I had to compute water levels from the verified water levels for the 9414290 San Francisco station. The San Francisco station is the reference used by the NOAA to make the predictions for the Richmond station (Corrections Applied: Times: High +0 hr. 24 min., Low +0 hr. 38 min., Heights: High *1.04, Low *0.98). The NOAA predicted a high tide of 6.09 for the San Francisco station (6.3 feet predicted for Richmond station). Verified water levels for the San Francisco station show the tide only reached 5.73. That computes to a 5.96 actual water level for the Richmond station.1 See conversion chart.
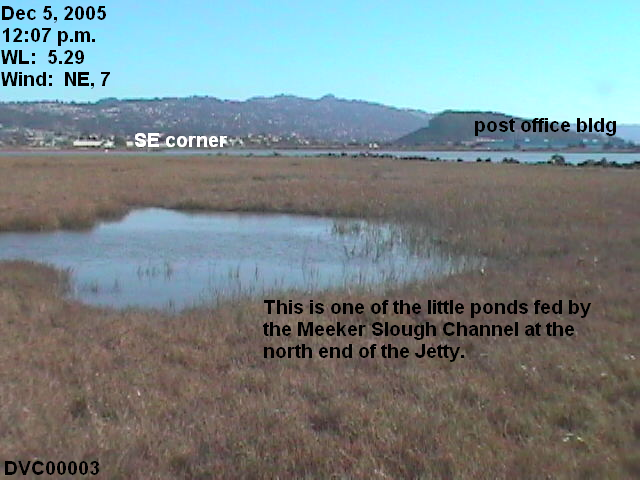
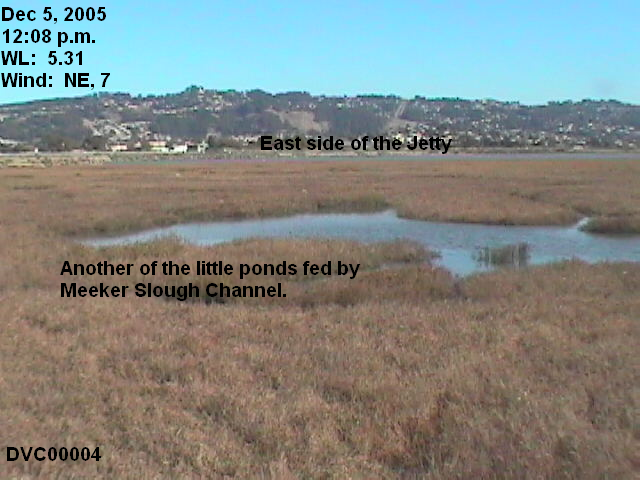
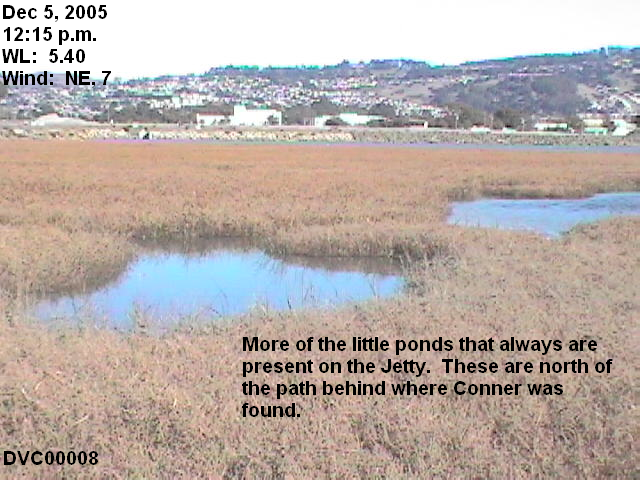
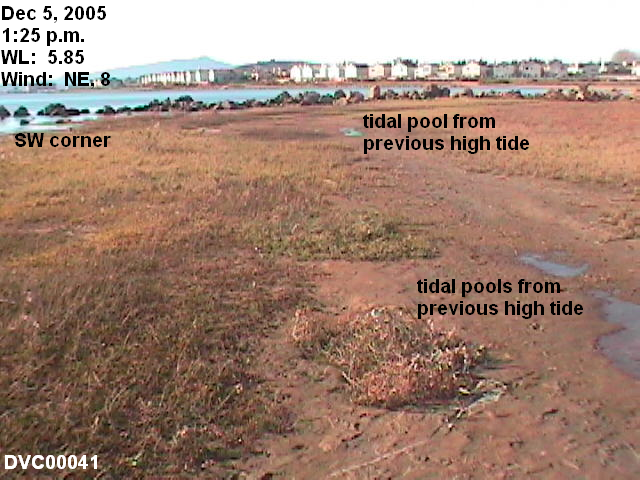
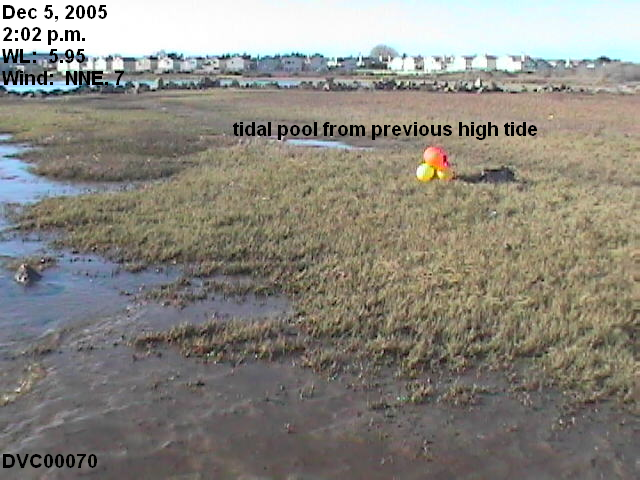
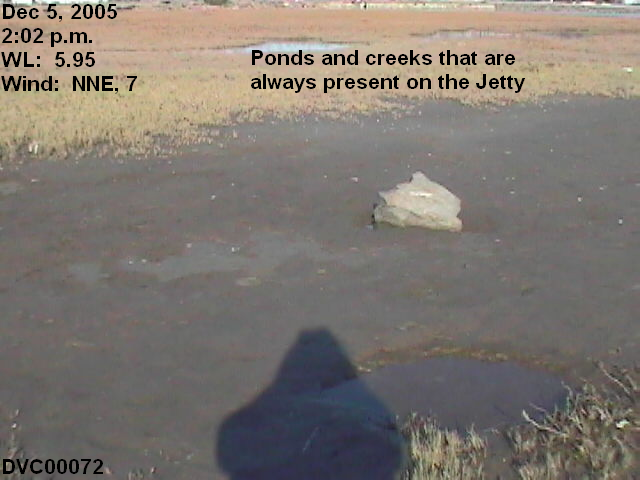
In the pictures, you will see tidal pools from the high tides from the previous four days:
December 1: 7.58 feet, more than 19 inches above this high tide
December 2: 7.01 feet, more than a foot above this high tide
December 3: 6.51 feet, 6.6 inches above this high tide
December 4: 6.34 feet, 4 1/2 inches above this high tide
Wind Speed and Direction
Wind information isn't available from the 9414863 Richmond, Chevron Pier station. The UC Richmond station reports the following wind conditions (click here for wind direction degrees):
12 Noon, 7 mph, 53 degrees (NE)
1 p.m., 8 mph, 36 degrees (NE)
2 p.m., 7 mph, 19 degrees (NNE)
3 p.m., 6 mph, 10 degrees (N)
The LA Times reports the following wind conditions for the Oakland Airport:
11:53 a.m., 10.4 mph, NNE
12:53 p.m., 11.5 mph, gusting to 18.4 mph, NE
1:53 p.m., 12.7 mph, NNE
2:53 p.m., 11.5 mph, NNE
The limited wave action in the pictures suggests the UC Richmond station winds are correct, and that is what I used to edit the pictures.
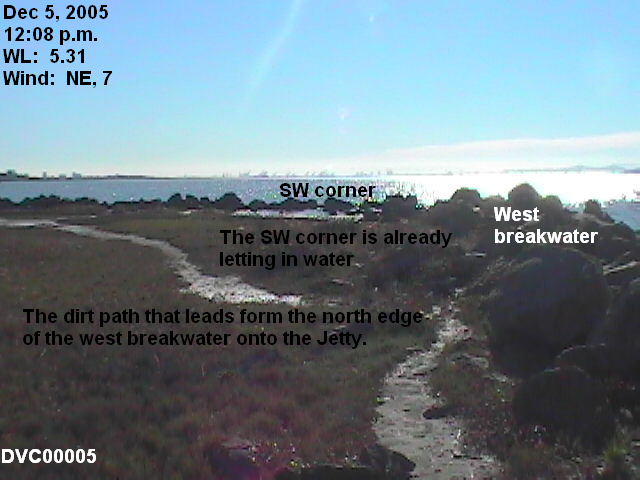
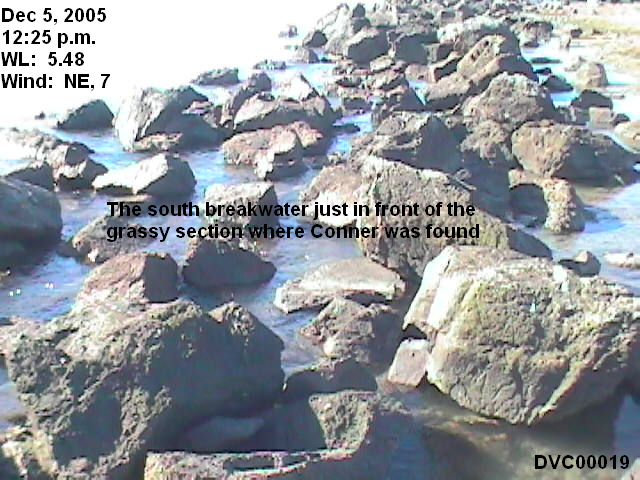
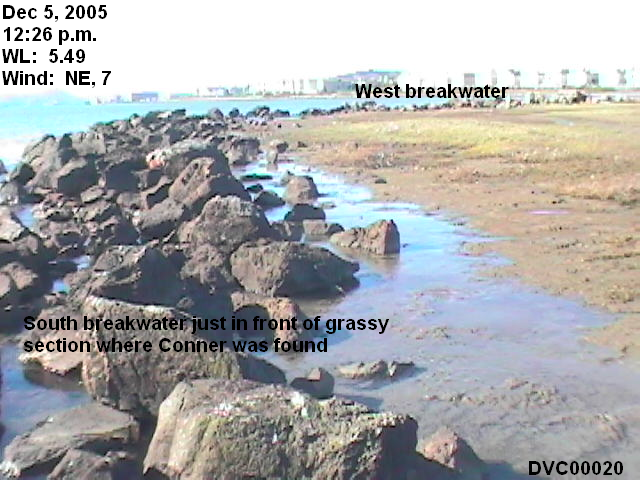
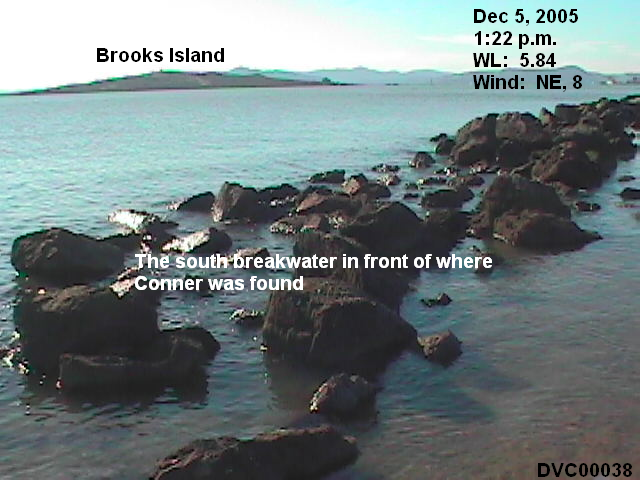
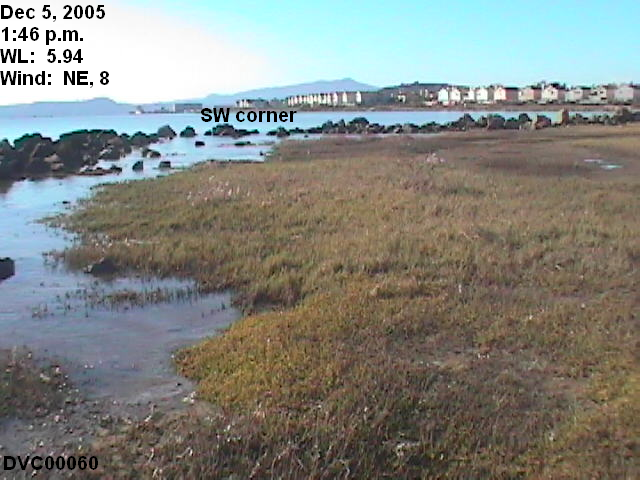
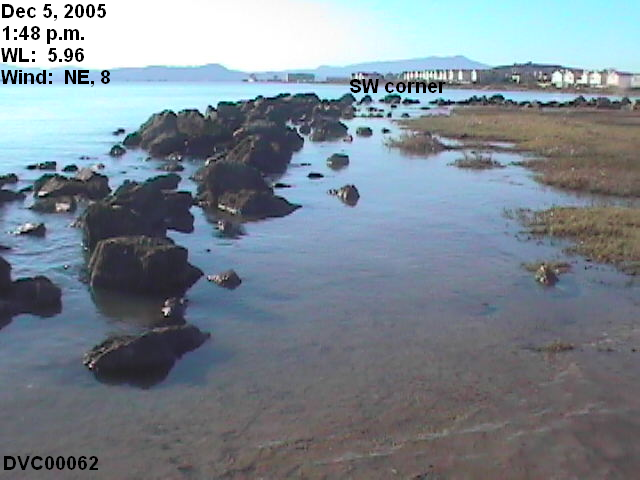
The calm winds help us understand what the actual water level is. When winds produce strong waves, the water level seems to be higher, because of the height of the waves, but it is not. Regardless of the wave height, the water level must be a certain height in order to an object to "pass over" these rocks. Navigating through the rocks would be very treacherous, especially during high winds.
The water levels for the high tides previous to Conner being found
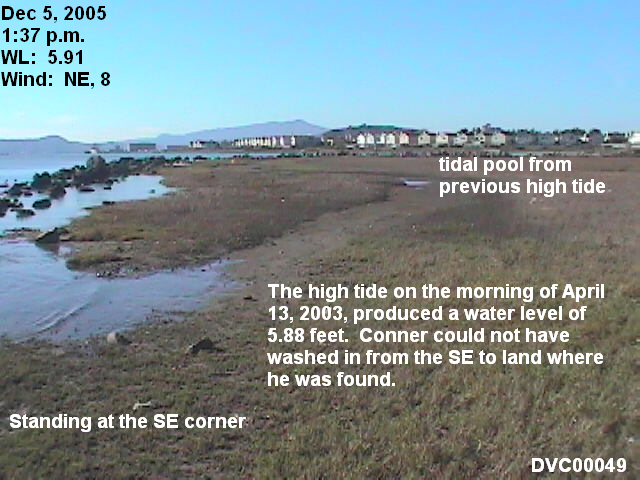
Conner was found in the late afternoon. These are the high/low water levels for April 12-13, 2003, for the Richmond Station. The 6-minute verified water level tables give slightly higher water levels for the high tides -- 5.77, 5.58, and 5.88 respectively. .01 is the equivalent of 1/10th of an inch. The HH stands for higher-high water tide.
9414863 20030412 03:06
2.88 L
9414863 20030412 08:42
5.76 HH
9414863 20030412 15:36 0.38 LL
9414863 20030412 22:36
5.57 H
9414863 20030413 04:00 2.39 L
9414863 20030413 10:00
5.87 HH
9414863 20030413 16:24 0.12 LL
9414863 20030413 23:12 5.68 H
Pictures & Videos
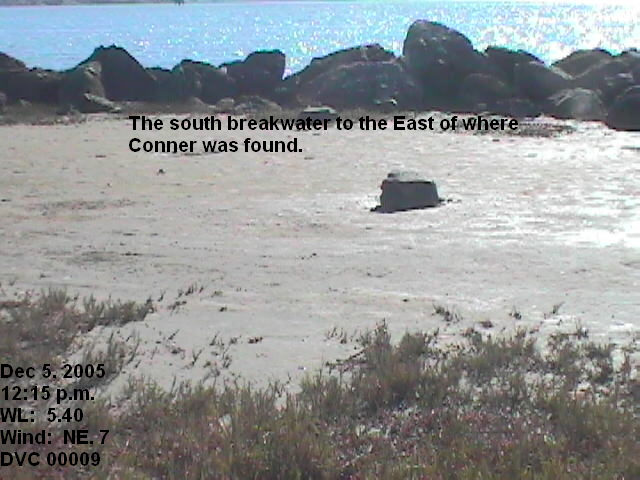
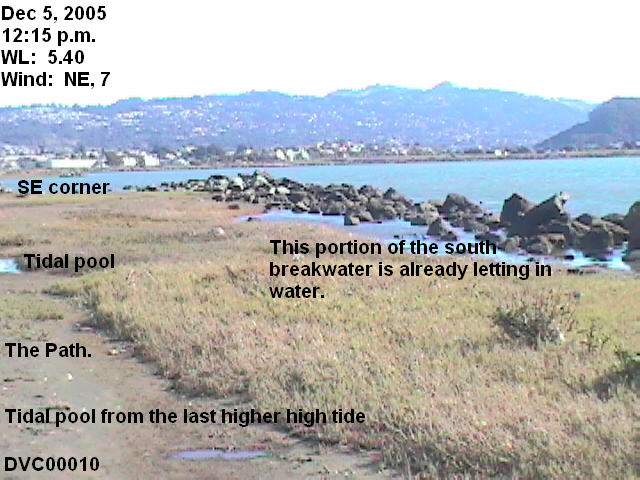
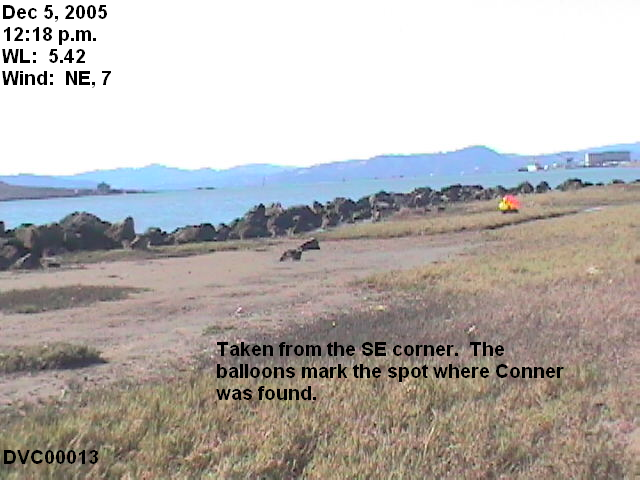
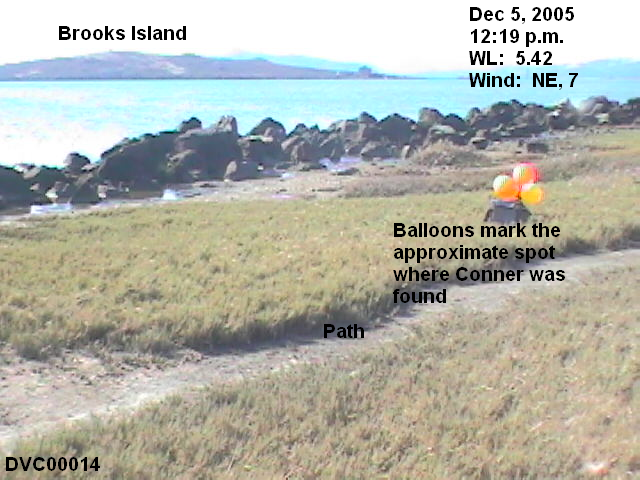
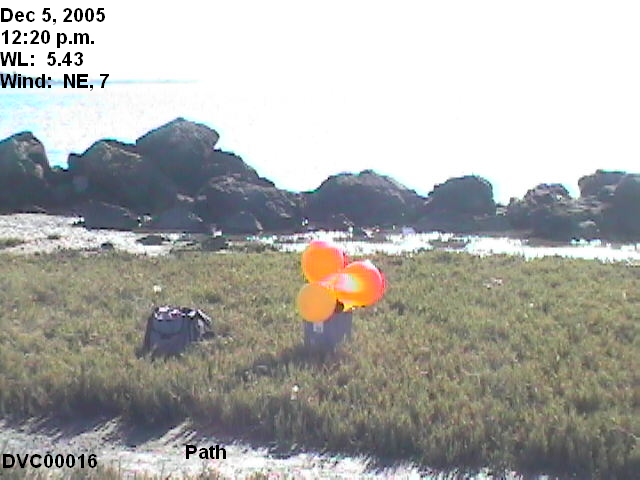
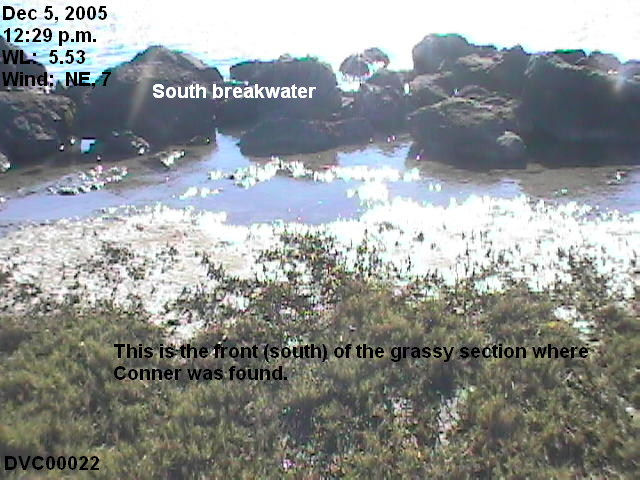
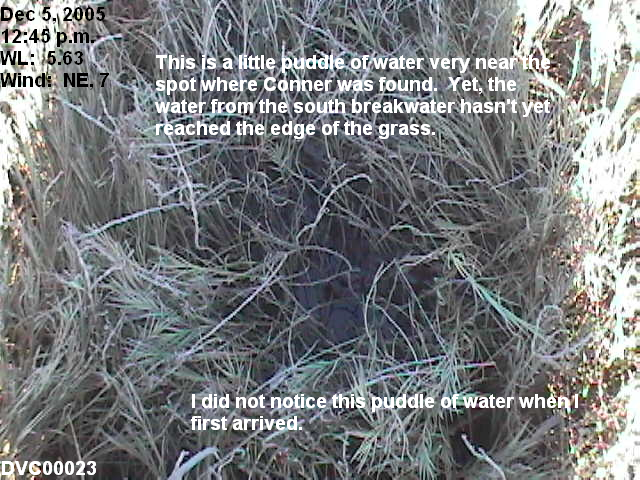
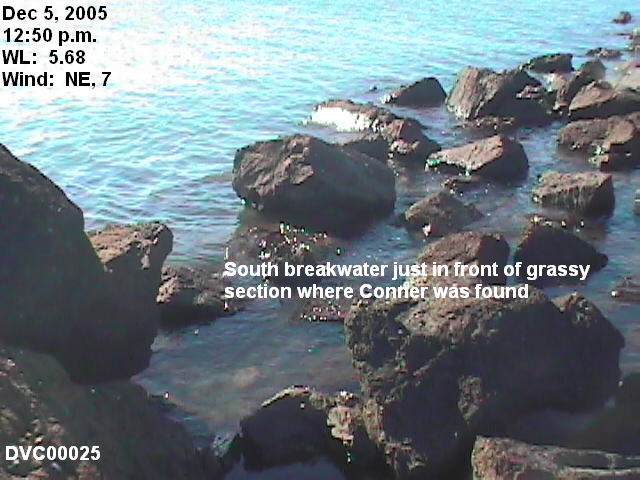
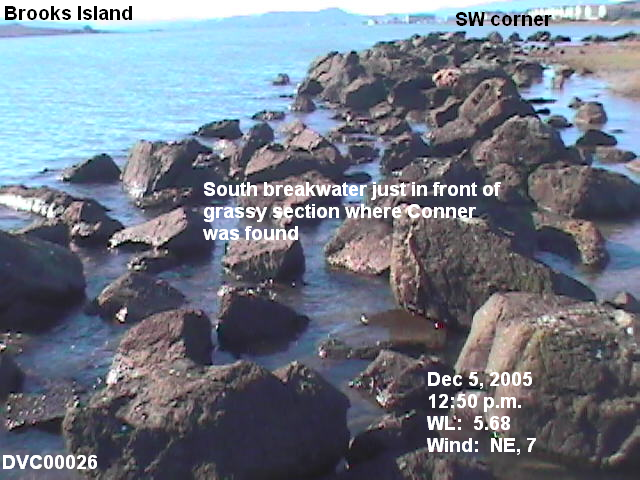
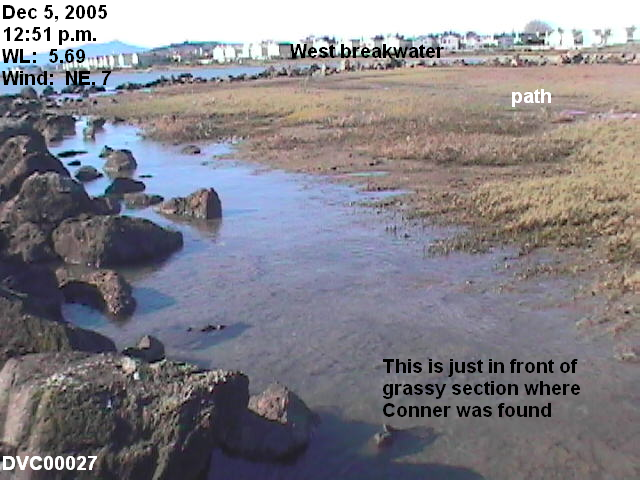
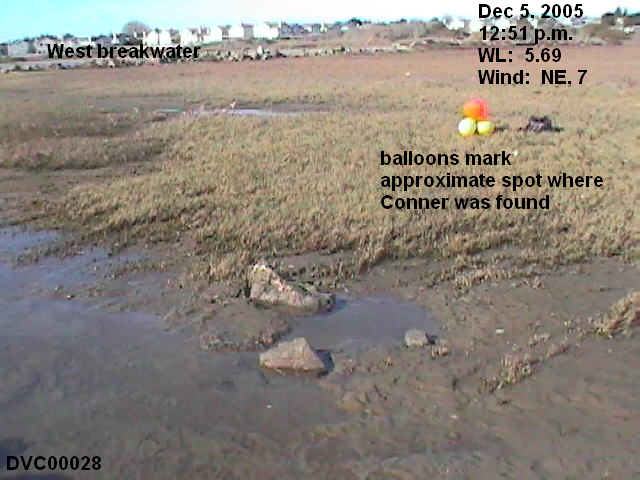
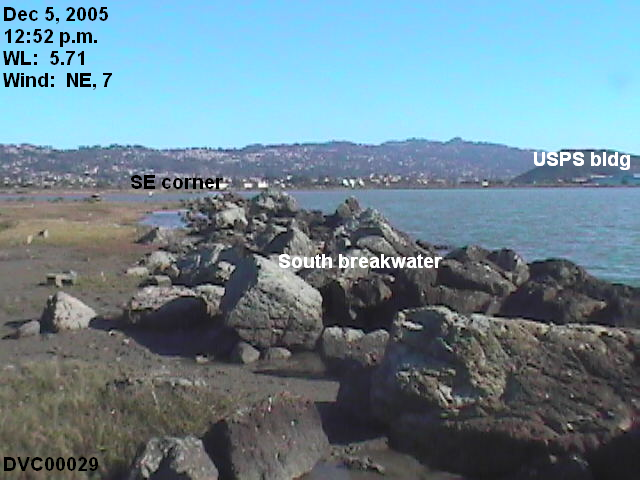
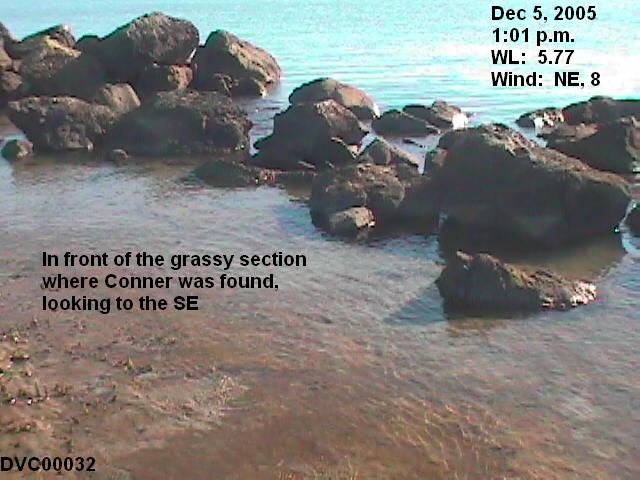
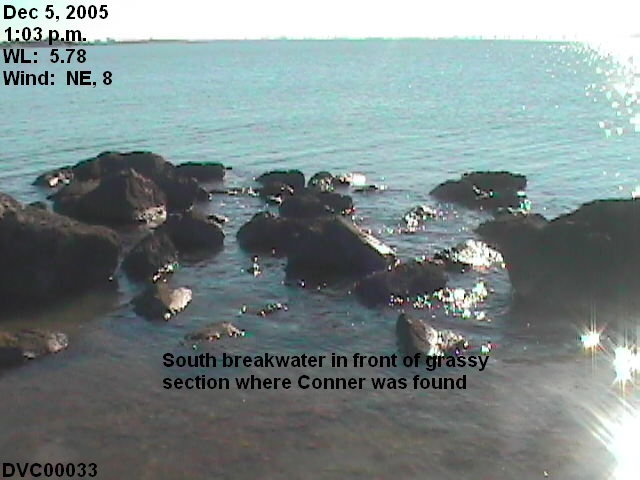
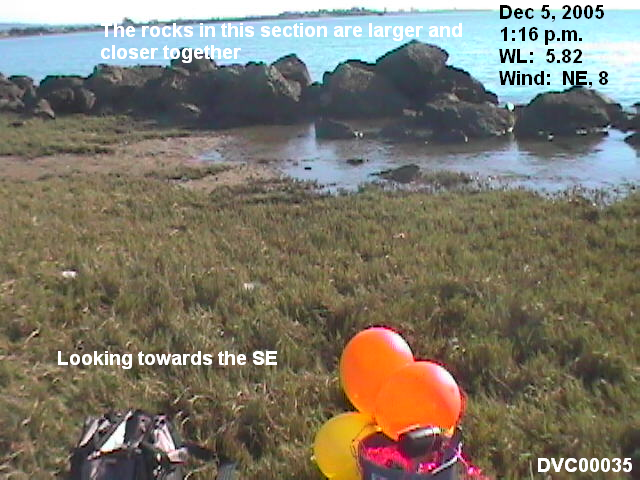
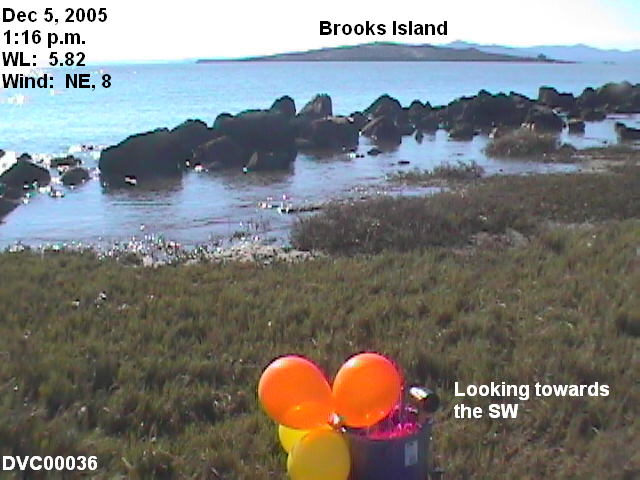
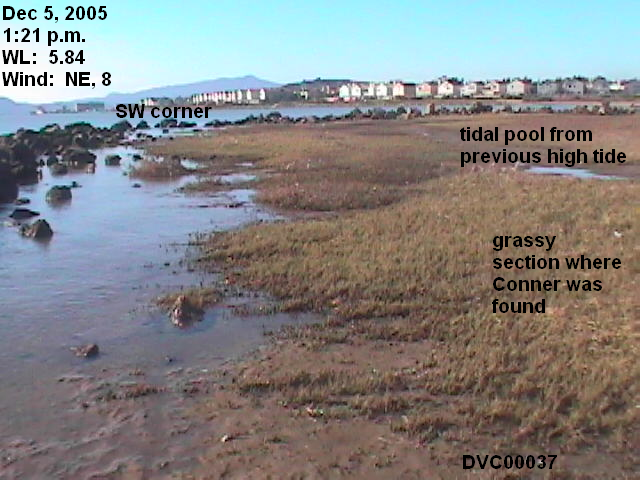
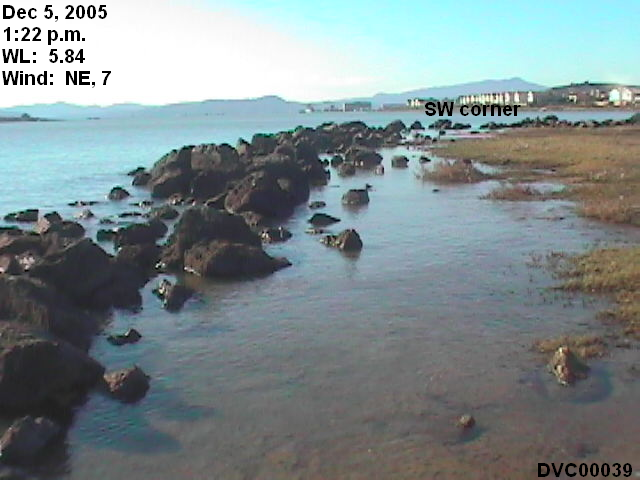
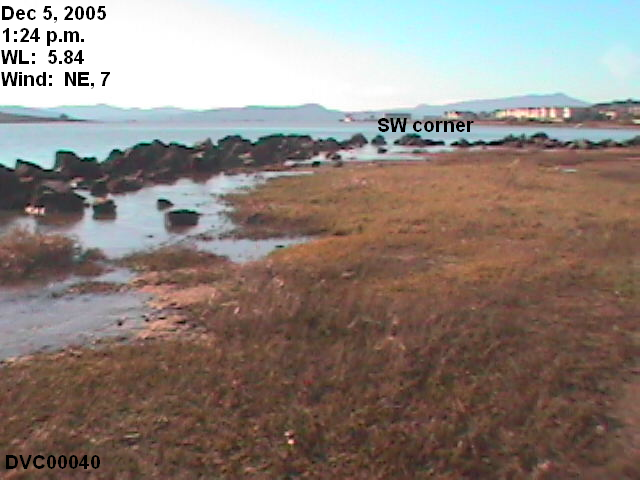
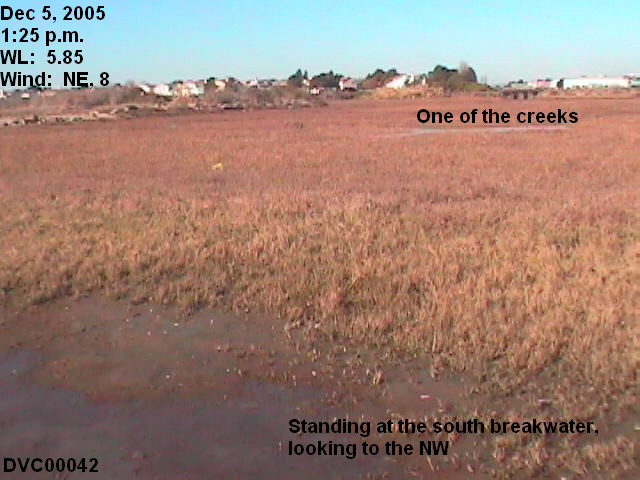
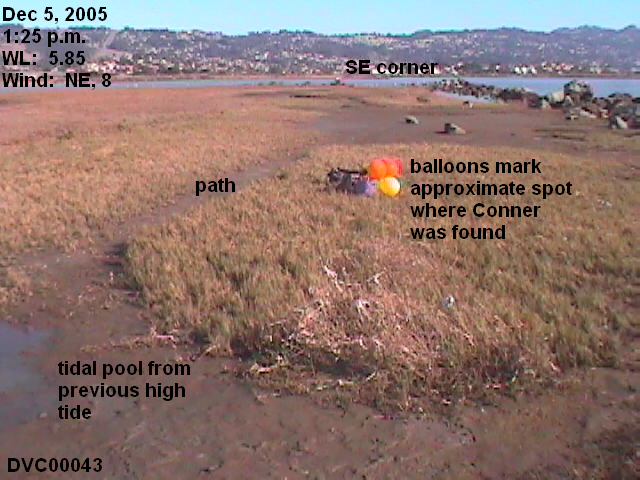
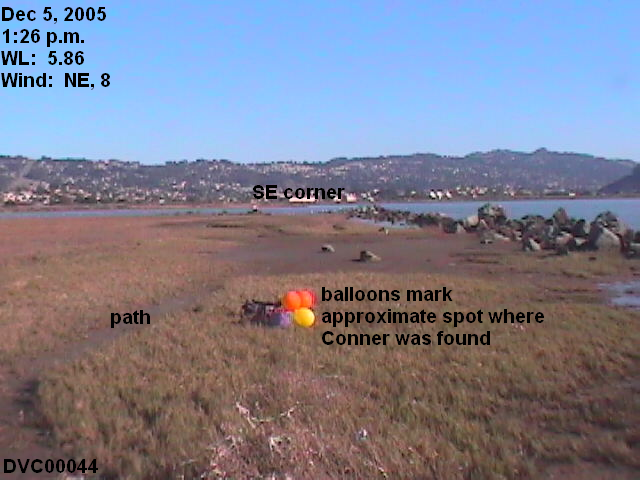
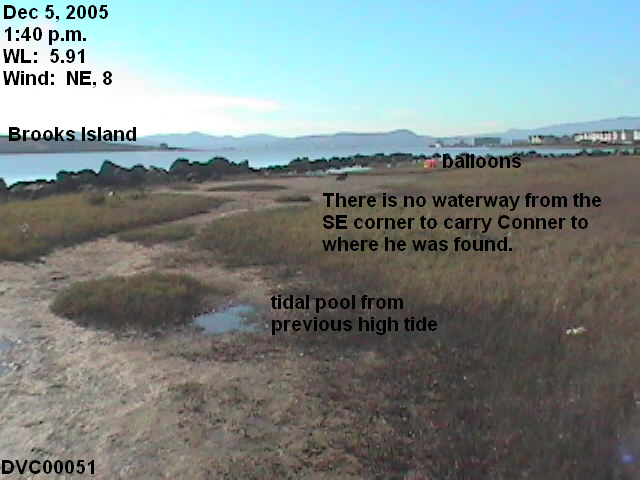
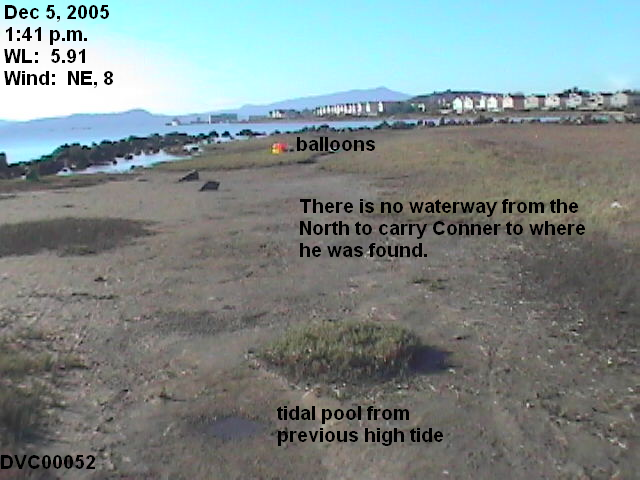
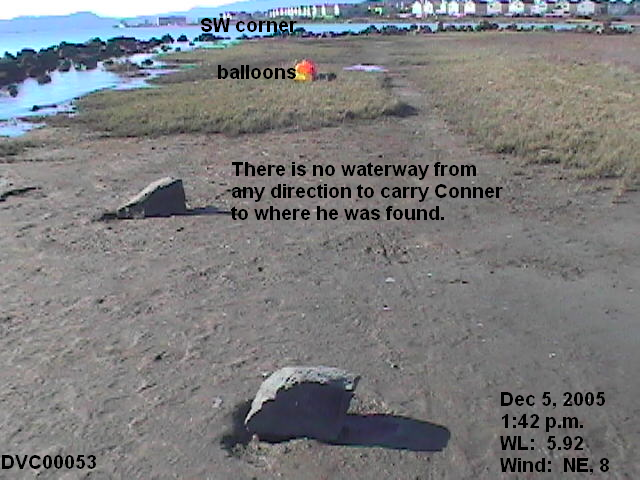
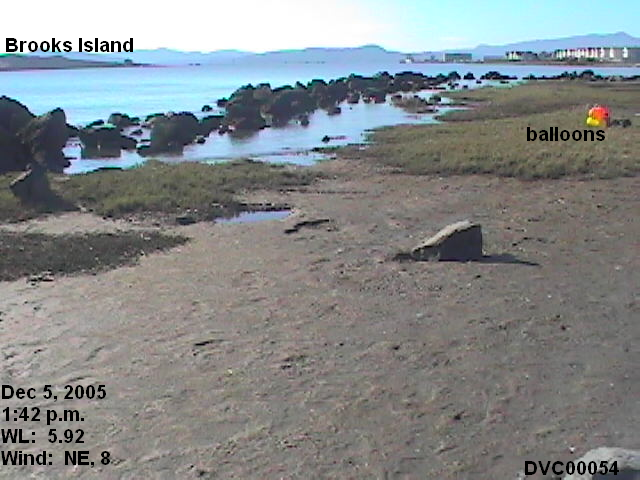
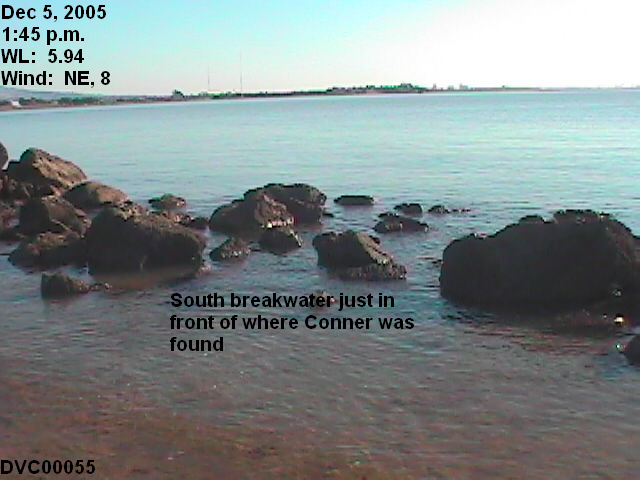
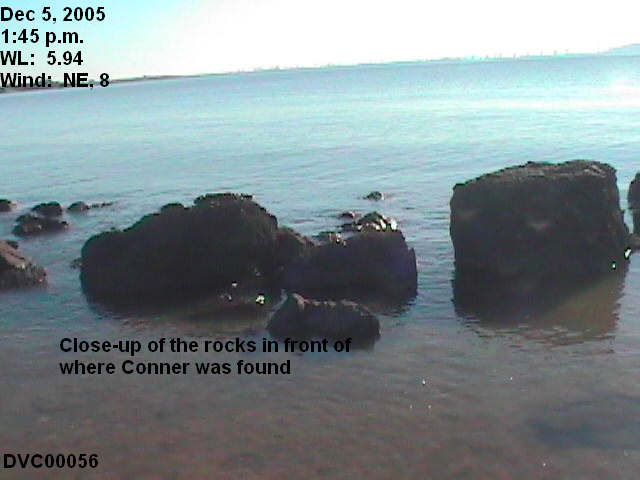
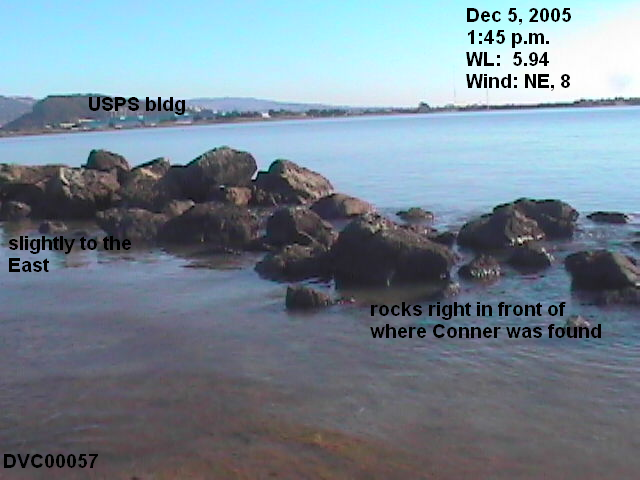
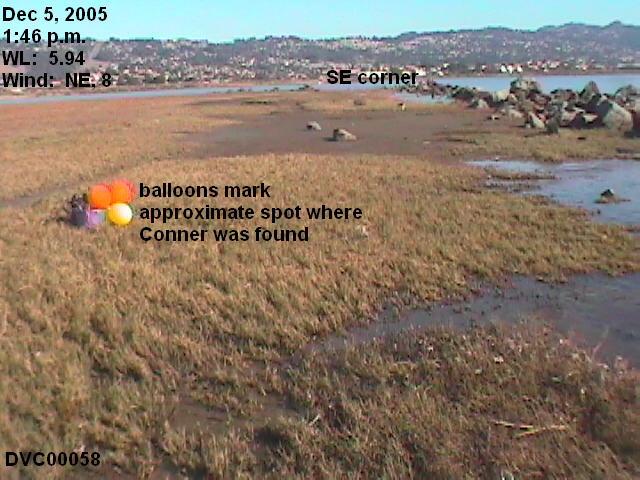
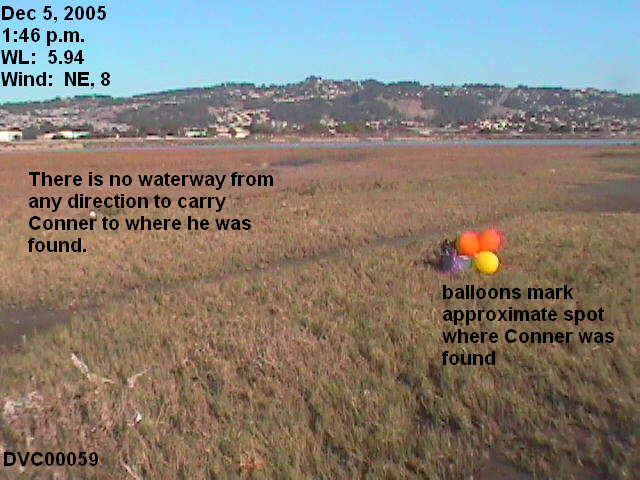
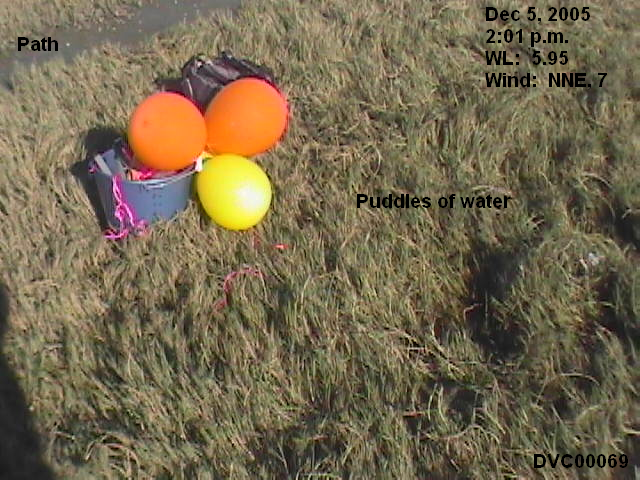
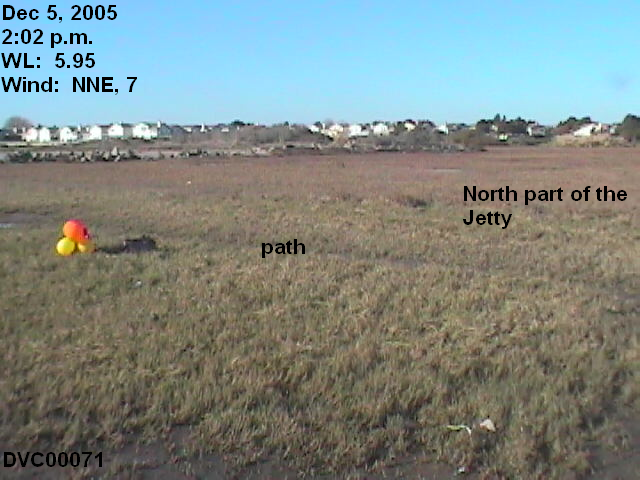
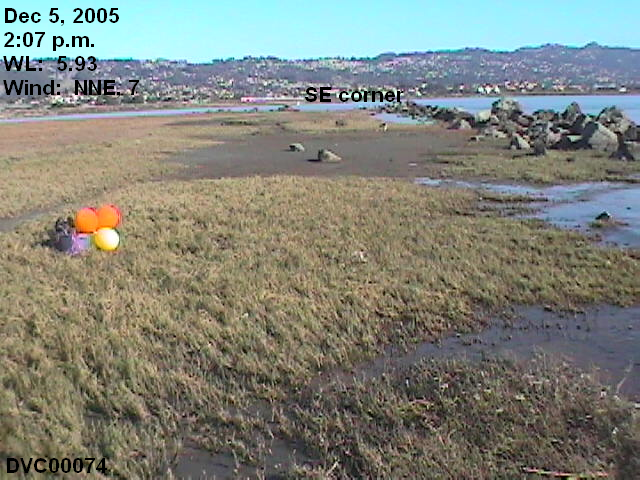
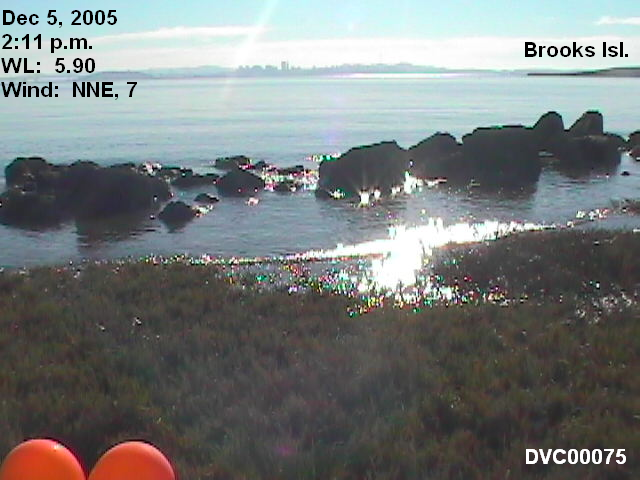
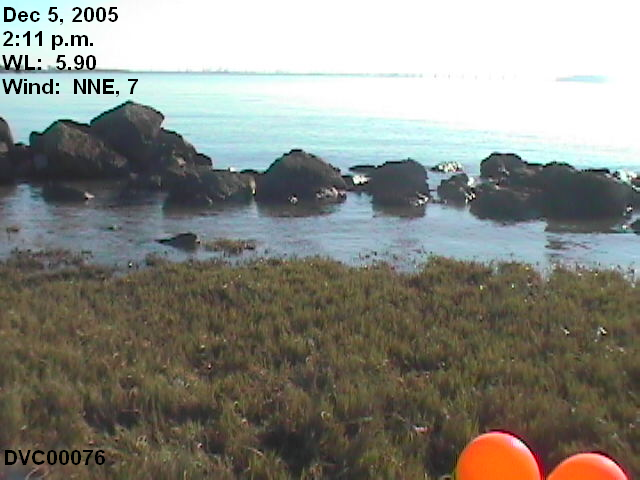
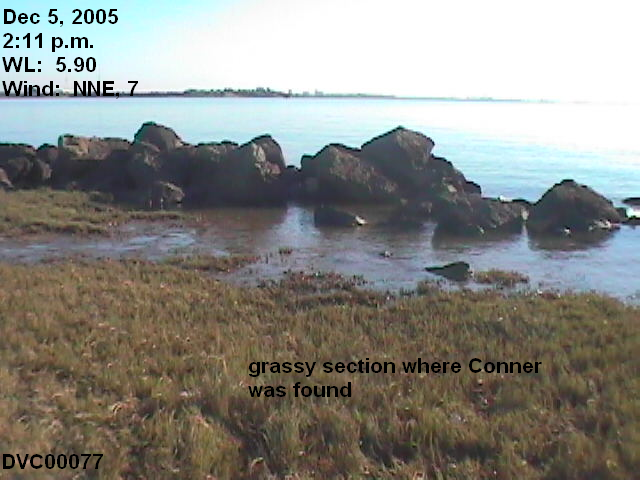
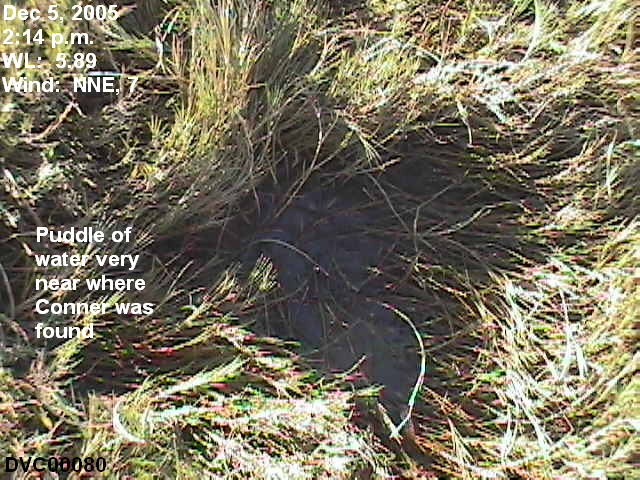
I took a total of 78 pictures and 8 videos. The pictures have been annotated to give the date, time, water level, wind conditions, and other necessary identifications. The videos are narrated. The blue bucket with balloons is the approximate location where Conner's body was found. I used this to provide a focal point in the pictures. I include the pictures for those who have slow connections, or don't want to spend time watching the videos. For this particular field trip, the pictures tell the story well enough.
Because the purpose of this field trip was to determine if Conner could have washed ashore from any direction, each video is a full sweep of the jetty, taken from just behind the blue bucket, which marks the approximate location of Conner's body. Select the Low videos if you have a dial-up, as they are smaller files. However, the High ones are much better quality.
Tip on viewing the videos. Full screen distorts the video. If the video opens at full screen, click the maximize button (to the left of the X exit button at the top right) to decrease the viewing size. You can further decrease the size by putting your cursor at one of the corners and dragging it in. The smaller the viewing area, the sharper the picture.


Video One: High Low Start Time: 12:17


Video Two: High Low Start Time: 12:26

Video Three: High Low Start Time: 12:42

Video Four: High Low Start Time: 12:53

Video Five: High Low Start Time: 1:17
Video Six: High Low Start Time: 1:36


Video Seven: High Low Start Time: 1:58


Video Eight: High Low Start Time: 2:10

Conclusion
Conner could not have washed ashore from any direction under these conditions. The calm winds enabled us to see the actual water height produced by this tide, unaffected by water being pushed through the rocks by the waves. Pictures of the rocks at these water levels illustrate how treacherous it would have been for Conner to pass through them at these water levels. The stronger the winds and higher the waves, the more he would have beat against the rocks.
1When I first published these pictures, I miscalculated the water level from the San Francisco Station data. I mistakenly added .104 instead of multiplying by 1.04. That produced lower water levels than were actually recorded. For example, 5.87 + .104 = 5.97; 5.87 x 1.04 = 6.10. I went back to check my calculations because my previous results were so much more below the predicted water levels for the Richmond station than the NOAA recorded for the San Francisco station. This same error was made on the December 13, 2005 field trip pictures.